


Cy0 is a new method in Real-time PCR analysis that does not require the assumption of equal efficiency between unknowns and standard curve.
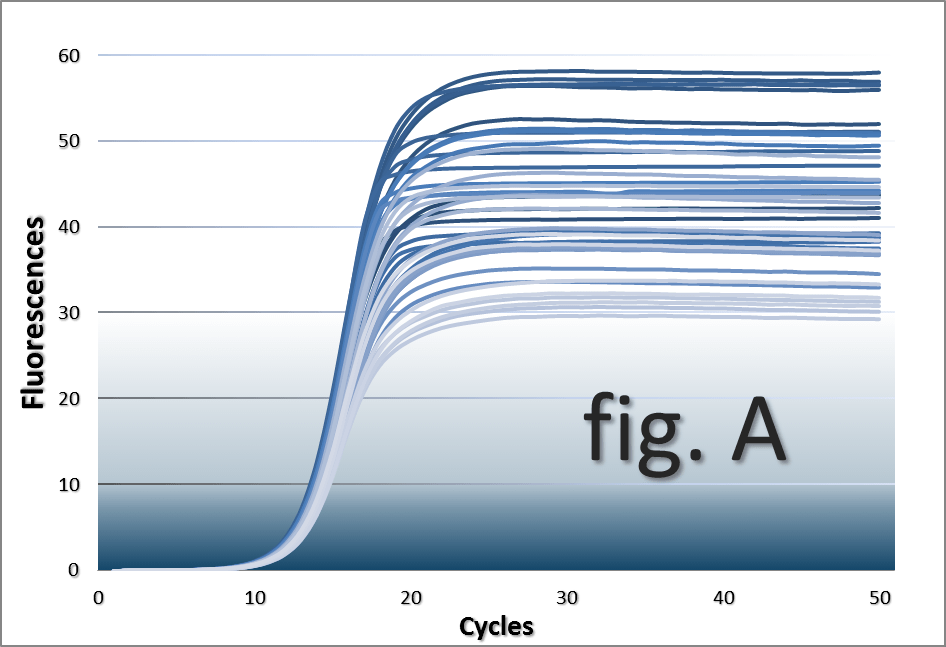 Quantitative real-time PCR quantifications performed in the presence of serial dilutions of IgG
(0.0625 - 2 mg/ml) acting as the inhibitory agent. This inhibition system produces curves
which are progressively less steep than non-inhibited reactions
with increasing IgG concentrations (fig. A).
Quantitative real-time PCR quantifications performed in the presence of serial dilutions of IgG
(0.0625 - 2 mg/ml) acting as the inhibitory agent. This inhibition system produces curves
which are progressively less steep than non-inhibited reactions
with increasing IgG concentrations (fig. A).
Relative Errors
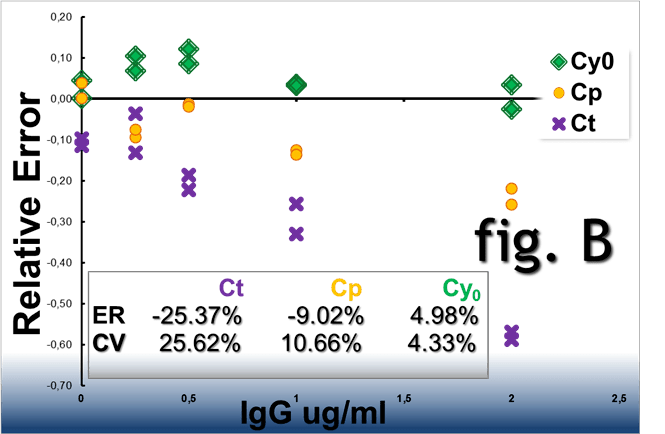 Real-time PCR amplification plots obtained from the
same starting DNA in the presence of IgG acting as
reaction inhibitor. When analysed
by the Ct, Cp and Cy0 methods these curves showed a RE% of
-25.37%, -9.02% and 4.98% and a CV% of 25.62%, 10.66% and
4.33%%, respectively (fig. B).
Real-time PCR amplification plots obtained from the
same starting DNA in the presence of IgG acting as
reaction inhibitor. When analysed
by the Ct, Cp and Cy0 methods these curves showed a RE% of
-25.37%, -9.02% and 4.98% and a CV% of 25.62%, 10.66% and
4.33%%, respectively (fig. B).
Shape Outliers detection (S.O.D.) analysis ▼
SOD: the method allows to verify if in a given set of experimental
amplification curves there is one or more among them which quantification result is
significantly biased.
S.O.D. compares the standard calibration curves shape, with that of every experimental run.
If the experimental curve shape is different (i.g. inhibitors) it is probable that standard
quantification methods may provide biased results (see fig. B above).
In such cases has been shown that
Cy0 (and now advanced CyS) combined with S.O.D. allow to minimize
quantification error either to reveal the presence of outliers.
To get SOD analisys the user has to upload:
- Standard curve calibration runs
- Experimental curve raw data runs
Related Works Abstracts
A new real-time PCR method to overcome significant quantitative inaccuracy due to slight amplification inhibition ▼
Background:Real-time PCR analysis is a sensitive DNA quantification technique that has recently gained considerable attention in biotechnology, microbiology and molecular diagnostics. Although, the cycle-threshold (Ct) method is the present "gold standard", it is far from being a standard assay. Uniform reaction efficiency among samples is the most important assumption of this method. Nevertheless, some authors have reported that it may not be correct and a slight PCR efficiency decrease of about 4% could result in an error of up to 400% using the Ct method. This reaction efficiency decrease may be caused by inhibiting agents used during nucleic acid extraction or copurified from the biological sample. We propose a new method (Cy0) that does not require the assumption of equal reaction efficiency between unknowns and standard curve.
Results: The Cy0 method is based on the fit of Richards' equation to real-time PCR data by nonlinear regression in order to obtain the best fit estimators of reaction parameters. Subsequently, these parameters were used to calculate the Cy0 value that minimizes the dependence of its value on PCR kinetic. The Ct, second derivative (Cp), sigmoidal curve fitting method (SCF) and Cy0 methods were compared using two criteria: precision and accuracy. Our results demonstrated that, in optimal amplification conditions, these four methods are equally precise and accurate. However, when PCR efficiency was slightly decreased, diluting amplification mix quantity or adding a biological inhibitor such as IgG, the SCF, Ct and Cp methods were markedly impaired while the Cy0 method gave significantly more accurate and precise results.
Conclusion: Our results demonstrate that Cy0 in represents a significant improvement over the standard methods for obtaining a reliable and precise nucleic acid quantification even in sub-optimal amplification conditions overcoming the underestimation caused by the presence of some PCR.
We propose a new method 'Cy0' that does not require the assumption of equal reaction efficiency between unknowns and standard curve in Real Time PCR quantification method.
Shape based kinetic outlier detection in RT-PCR ▼
Background: Real-time PCR has recently become the technique of choice for absolute and relative nucleic acid quantification. The gold standard quantification method in real-time PCR assumes that the compared samples have similar PCR efficiency. However, many factors present in biological samples affect PCR kinetic, confounding quantification analysis. In this work we propose a new strategy to detect outlier samples, called SOD.
Results: Richards function was fitted on fluorescence readings to parameterize the amplification curves. There was not a significant correlation between calculated amplification parameters (plateau, slope and y-coordinate of the inflection point) and the Log of input DNA demonstrating that this approach can be used to achieve a "fingerprint" for each amplification curve. To identify the outlier runs, the calculated parameters of each unknown sample were compared to those of the standard samples. When a significant underestimation of starting DNA molecules was found, due to the presence of biological inhibitors such as tannic acid, IgG or quercitin, SOD efficiently marked these amplification profiles as outliers. SOD was subsequently compared with KOD, the current approach based on PCR efficiency estimation. The data obtained showed that SOD was more sensitive than KOD, whereas SOD and KOD were equally specific.
Conclusion: Our results demonstrated, for the first time, that outlier detection can be based on amplification shape instead of PCR efficiency. SOD represents an improvement in real-time PCR analysis because it decreases the variance of data thus increasing the reliability of quantification.
Evaluation of qPCR curve analysis methods for reliable biomarker discovery: Bias, resolution, precision, and implications▼
RNA transcripts such as mRNA or microRNA are frequently used as biomarkers to determine disease state or response to therapy. Reverse transcription (RT) in combination with quantitative PCR (qPCR) has become the method of choice to quantify small amounts of such RNA molecules. In parallel with the democratization of RT-qPCR and its increasing use in biomedical research or biomarker discovery, we witnessed a growth in the number of gene expression data analysis methods. Most of these methods are based on the principle that the position of the amplification curve with respect to the cycle-axis is a measure for the initial target quantity: the later the curve, the lower the target quantity. However, most methods differ in the mathematical algorithms used to determine this position, as well as in the way the efficiency of the PCR reaction (the fold increase of product per cycle) is determined and applied in the calculations. Moreover, there is dispute about whether the PCR efficiency is constant or continuously decreasing. Together this has lead to the development of different methods to analyze amplification curves. In published comparisons of these methods, available algorithms were typically applied in a restricted or outdated way, which does not do them justice. Therefore, we aimed at development of a framework for robust and unbiased assessment of curve analysis performance whereby various publicly available curve analysis methods were thoroughly compared using a previously published large clinical data set (Vermeulen et al., 2009)[11].
The original developers of these methods applied their algorithms and are co-author on this study. We assessed the curve analysis methods' impact on transcriptional biomarker identification in terms of expression level, statistical significance, and patient-classification accuracy. The concentration series per gene, together with data sets from unpublished technical performance experiments, were analyzed in order to assess the algorithms' precision, bias, and resolution. While large differences exist between methods when considering the technical performance experiments, most methods perform relatively well on the biomarker data. The data and the analysis results per method are made available to serve as benchmark for further development and evaluation of qPCR curve analysis methods (https://qPCRDataMethods.hfrc.nl).
Keywords: qPCR curve analysis; Transcriptional biomarker; Bias; Precision; Resolution; Benchmark