- ¹D. Sisti, ²M. Guescini, R. Panebianco, P. Tibollo, M. Mantuano, M. B.L. Rocchi, V. Stocchi.
- ¹Istituto di Biomatematica, Polo Scientifico Loc. Crocicchia ,Università degli studi di Urbino "Carlo Bo", Urbino.
- ²Istituto di Ricerca sull'Attività Motoria, Via Sasso 75, Università degli studi di Urbino "Carlo Bo", Urbino.
www.cy0method.org @: [email protected]
Introduction
Real-time PCR has become the technique of choice for absolute and relative nucleic acid quantification. The gold standard quantification method in real-time PCR (Ct) assumes that the compared samples have similar PCR efficiency. In order to overcome inaccuracy in qPCR due to efficiency decrease, outlier detection methods have been developped. Recently a new method (SOD) showed a high sensitivity and specificity to detect outlier runs. Instead, a new DNA quantification method, called Cy0, show better accuracy, even if in presence of decreasing efficiency due to, for example, inhibitor presence. In this paper we compare DNA quantification obtained using Cy0 and Ct methods utilization, related to SOD value.Methods
- Quantitative Real-Time PCR
The DNA standard consisted of a pGEM-T (Promega) plasmid containing a 104 bp fragment of the mitochondrial gene NADH dehydrogenase 1 (MT-ND1) as insert. This DNA fragment was produced by the ND1/ND2 primer pair (forward ND1: 5'-ACGCCATAAAACTCTTCACCAAAG-3' and reverse ND2: 5'-TAGTAGAAGAGCGATGGTGAGAGCTA-3').For Ct (fit point method) evaluation, a fluorescence threshold manually set to 0.4 was used for all runs, were log10 transformed were linear. - Inhibitors
Four sample sets have been used: standard amplification curves, Fixed DNA concentration added of tannic acid (ranging from 0.00039 to 0.1 mg/mL), IgG (ranging from 0.00039 to 0.2 mg/mL), and quercitin (ranging from 0.00031 to 0.04 mg/mL), - Cy0 quantification
The Cy0 value is the intersection point between the abscissa axis and tangent of the inflection point of the Richards curve obtained by the non-linear regression of raw data.The Cy0 method was performed by nonlinear regression fitting of the Richards function , in order to fit fluorescence readings to the 5-parameter Richards function.
|
|
|
SOD model
Shape based kinetic outlier detection (SOD) was based on the shapes of the amplification curves. In order to fit fluorescence raw data, non�linear regression fitting of 5-parameter Richards function were performed.The shape parameters used were the plateau value of amplification curve (Fmax), tangent straight line slope in inflection point (m) and y-coordinate of inflection point (Yf). SOD value is based on Mahalanobis distance; it is a useful way of determining the similarity of an unknown multivariate sample set to a known one. Then if ?2 > 7.81, we can reject the null hypothesis and establish that the shape of the amplification curve is different from the shape of the standard curve samples, considering all 3 parameters . Cy0 were calculated using the present www.cy0method.org, specifically developed.|
|
|
|
|
|
||
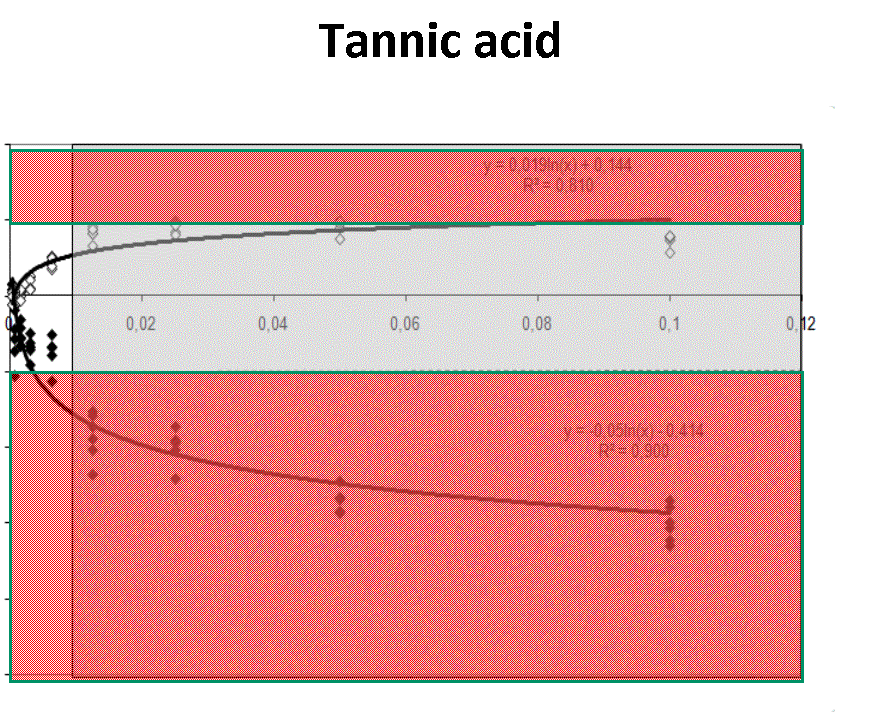
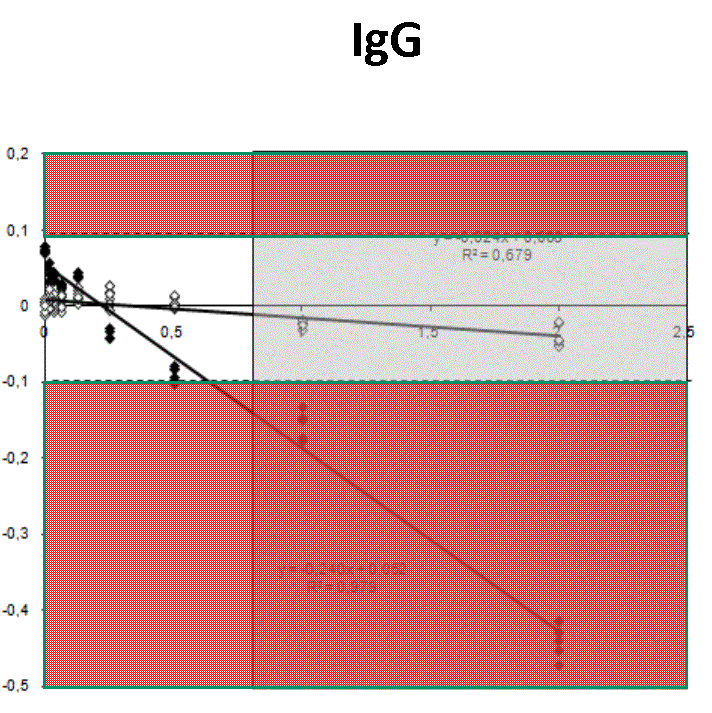
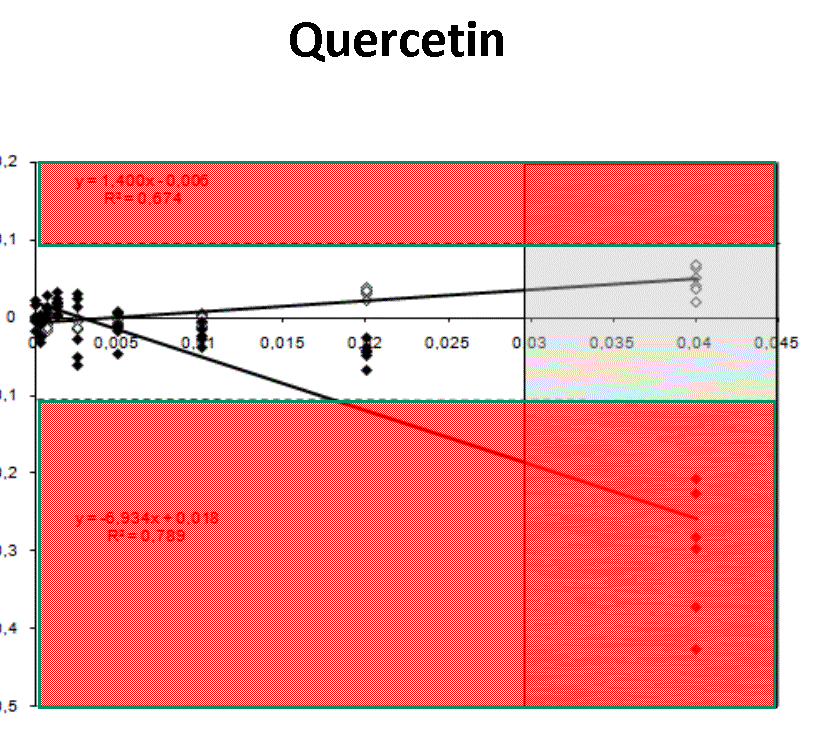
Residues distribution (Log(Nob/Nexp))


Quantification profiles obtained from samples with equal starting number of template molecules and increasing inhibitor concentrations. The ratio Log(Nob/Nexp) represents the residues obtained from linear regression of calibration curves where Log Nob is the number of calculated molecules using Ct (filled simbols) and Cy0 (open simbols) methods and Nexp is the number of expected molecules. Each symbol represents a single run. The dotted lines are the 95% confidence interval of the Log(Nob/Nexp) ratio calculated from standard curve runs. Ranges outside confidence intervals are red colored, whereas the grey areas represent hinibitors concentration at which the amplification curves shown a significant shape distorsion (SOD positive curve).
Results
For each runs, in presence of biological inhibitors such as tannic acid, IgG or quercitin, Cy0 and Ct values have been calculated. In presence of these inhibitors, SOD efficiently marked some of these amplification profiles as outliers and consequentially Dna quantification obtained using Ct was markedly impaired. Instead, Dna quantifications obtained with Cy0 method, were not significantly different from the expected values.Conclusion
Our results demonstrated, for the first time, that in presence of three different type of inhibitors at different concentrations, Cy0 method achieve quantification with accuracy significantly higher than Ct, even if in presence of outliers, detected by SOD.References
- Guescini M, Sisti D, Rocchi MB, Stocchi L, Stocchi V (2008). A new real-time PCR method to overcome significant quantitative inaccuracy due to slight amplification inhibition. BMC Bioinformatics. 30; 9:326.
- Sisti D, Guescini M, Rocchi MB, Tibollo P, D'Atri M, Stocchi V (2010). Shape based kinetic outlier detection in real-time PCR. BMC Bioinformatics. 12;11:186


